35C3CTF – box of blink
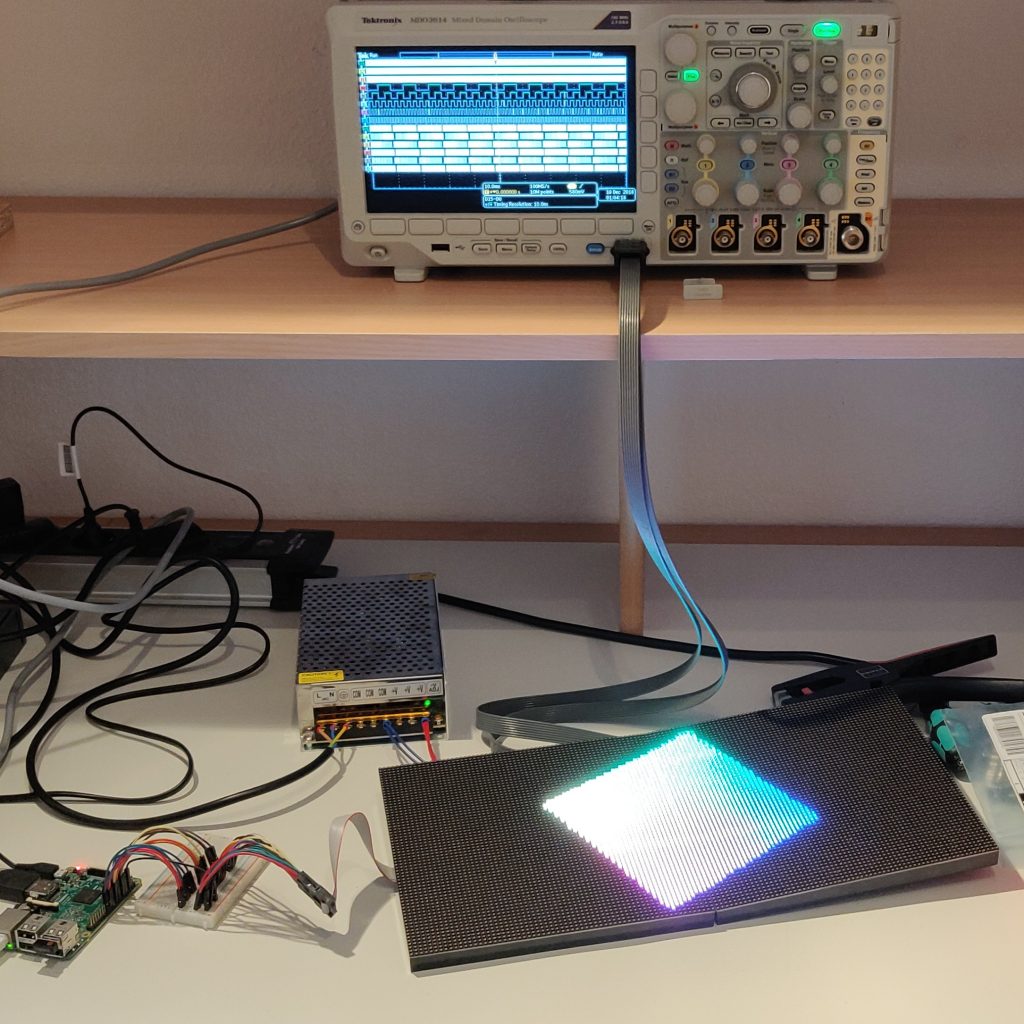
provided is a 400MB .csv file and a photo of an oscilloscope with logic inputs connected on to data bus between a raspberry pi and 2 chained led matrix boards.
Recon
after quick examination i realized the csv file was a log of the measurements from the oscilloscope.
the beginning of the file looked like this.
Model,MDO3014
 Firmware Version,1.26
 #
 Waveform Type,DIGITAL,,,,,,,,,,,,,
 Point Format,Y,,,,,,,,,,,,,
 Horizontal Units,s,,,,,,,,,,,,,
 Horizontal Scale,0.004,,,,,,,,,,,,,
 ,,,,,,,,,,,,,,
 Sample Interval,4e-09,,,,,,,,,,,,,
 Record Length,1e+07,,,,,,,,,,,,,
 Gating,0.0% to 100.0%,,,,,,,,,,,,,
 ,,,,,,,,,,,,,,
 Vertical Units,V,V,V,V,V,V,V,V,V,V,V,V,V,V
 Threshold Used,1.65,1.65,1.65,1.65,1.65,1.65,1.65,1.65,1.65,1.65,1.65,1.65,1.65,1.65
 ,,,,,,,,,,,,,,
 ,,,,,,,,,,,,,,
 ,,,,,,,,,,,,,,
 ,,,,,,,,,,,,,,
 ,,,,,,,,,,,,,,
 Label,OE,LAT,CLK,E,D,C,B,A,B2,B1,G2,G1,R2,R1
 TIME,D13,D12,D11,D10,D9,D8,D7,D6,D5,D4,D3,D2,D1,D0
 -1.0000000e-03,0,0,0,0,1,0,0,0,0,0,0,1,0,1
and continued with 400MB worth of lines like
-1.0000000e-03,0,0,0,0,1,0,0,0,0,0,0,1,0,1
I’ve worked a lot with digital oscilloscopes in the past so no need to look up any Information on this, since it’s still in my head.
but the only led matrix I’ve ever worked with was a home build one made from some cheap xmas-lights and a IR-strobe light for a industrial sheet metal inspection line.
After some googeling i found a nice tutorial on how to connect a led matrix to a arduino. with some explanation on what each pin is used for. https://learn.adafruit.com/32×16-32×32-rgb-led-matrix/connecting-with-jumper-wires
and since the labels are in the header of the blink.csv file are the same as the pin names. i can conclude that this it the same type of data bus.
so we have the following signal:

output enable bit - - to enable output.
latch bit         - - to indicate end of data
clock puls        - - to tell the board to read new data from the bus
A,B,C,D,E         - - to select what line(s) to send the output to.
R1,G1,B1          - - color data for the firs row.
R2,G2,B2          - - color data for the second row.


                     /------- OUTPUT ENABLE (TURNS ALL LEDS OFF OR ON)
                    /   /------LATCH (INDICATED END OF DATASTREAM)
                   /   /   /-- CLOCK PULSE
                  |   |   /  [    select rows   ][ blues][greens][reds  ]
Label,         | OE |LAT|CLK|E  |D  |C  |B  |A  |B2 |B1 |G2 |G1 |R2 |R1 |
-1.0000000e-03 | 0  | 0 | 0 | 0 | 1 | 0 | 0 | 0 | 0 | 0 | 0 | 1 | 0 | 1 |
The board ‘writes’ the color data from left to right to the selected line, latch resets the write Postion to the beginning of the line.
There are 2 lines writen at the same time its a 5bit adress so that means the first line is some were between 0 and 32 and the second is the same as the first+33
looking at the photo of the matrix broad that seemed to be right.
Now i know what im looking at, i just need to find a way to reproduce what was displayed on the matrix board.
cleaning up file.
There were a lot of dupplicate measurements because the sample rate of the oscilloscope was much higher than the bus speed.
So i decided to write a script cleaning out duplicate measurements to reduce file size. while i was doing this i was brain stroming on how to parse the data and display it.
Solution
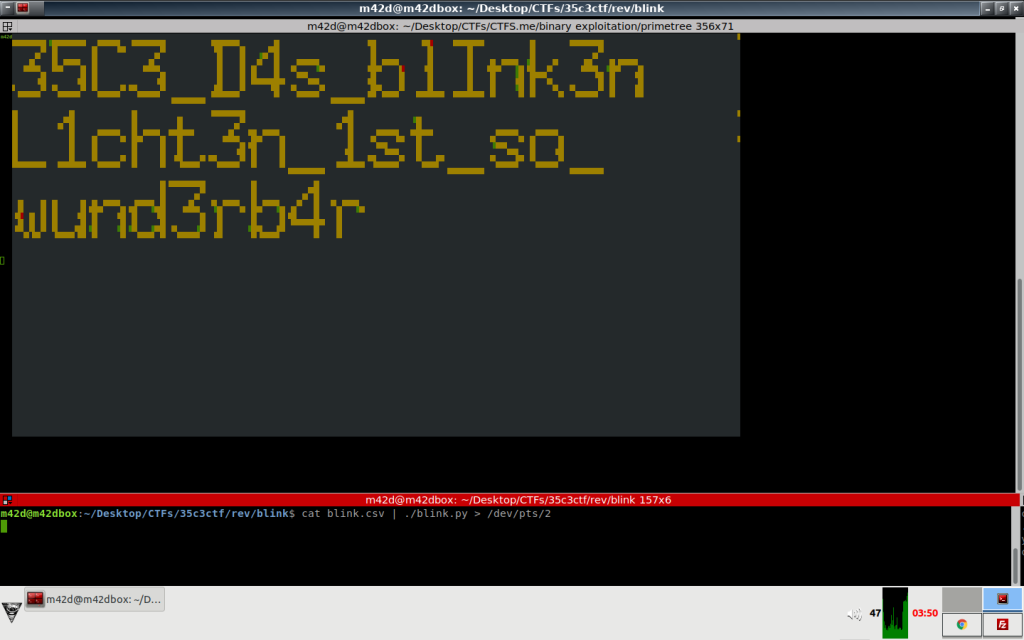
I decided it would be fun to output it in a terminal screen. write block Charterers and display and use v100 esacpe codes for color.
This is the code i came up with to pars the oscilloscope log file.
#!/usr/bin/python
# -*- coding: utf-8 -*-
'''''''''''''''''''''''''''''''' ' ' ' '''''''''''''''''''''''''''''''''''''''''

    ▄▄▄▄    ▄▄▄       █     █░ ██▓      ██████ ▓█████  ▄████▄
    ▓█████▄ ▒████▄    ▓█░ █ ░█░▓██▒    ▒██    ▒ ▓█   ▀ ▒██▀ ▀█
    ▒██▒ ▄██▒██  ▀█▄  ▒█░ █ ░█ ▒██░    ░ ▓██▄   ▒███   ▒▓█    ▄
    ▒██░█▀  ░██▄▄▄▄██ ░█░ █ ░█ ▒██░      ▒   ██▒▒▓█  ▄ ▒▓▓▄ ▄██▒
    ░▓█  ▀█▓ ▓█   ▓██▒░░██▒██▓ ░██████▒▒██████▒▒░▒████▒▒ ▓███▀ ░
    ░▒▓███▀▒ ▒▒   ▓▒█░░ ▓░▒ ▒  ░ ▒░▓  ░▒ ▒▓▒ ▒ ░░░ ▒░ ░░ ░▒ ▒  ░
    ▒░▒   ░   ▒   ▒▒ ░  ▒ ░ ░  ░ ░ ▒  ░░ ░▒  ░ ░ ░ ░  ░  ░  ▒
    ░    ░   ░   ▒     ░   ░    ░ ░   ░  ░  ░     ░   ░
    ░            ░  ░    ░        ░  ░      ░     ░  ░░ ░
      ░                                            ░
                       -=Bawling since 2017=-           ▒░
        ▒                                       ░
              ▒░        By: M42D                                ░
            ░          CTF: 35c3ctf
                  challege: box of blink                 ░
            ░                                         ░
                      date: 27-12-2018

              usage : cat blink.csv | ./blink.py

              notes : for best cinematic experiance adjust
                      your termial window to display a
                      resolution of 265x64 charcters

                      it's a damm shame the output wasn't
                      more animated and colorfull.

'''''''''''''''''''''''''''''''' ' ' ' '''''''''''''''''''''''''''''''''''''''''

B,A,W,L='',' ',' ',open(__file__).readlines()
for S in range(3,30):
    B+=L[S]
    if S>7 and S<13:
        A=L[S]+A
        W+=L[S]
print '\033[94m'+B+'\033[0m'
PB='\033[94m'+A+W+'\033[0m'
print "         sit back 'n enjoy"
print " "*40+"-xXx- M42D"
print PB
from time import sleep
sleep(5)
#-------------------------------------------------------------------------------
# END OF HEADER
#-------------------------------------------------------------------------------

file_out = 'catme.txt'
f = open(file_out, "w")

last_clk = '1'
last_oe  = '1'
last_lat = '1'

i=0 #string in counter
o=0 #string out counter

x=5 #knowing me x is probebly y
while 1:
    try:
        input = raw_input()
    except:
        f.close()
        print 'done..'
        print 'results saved to catme.txt'
        break
    #input skip the whole header section of the file
    i +=1
    if i > 24:
        if input == '' or input[0] == '#':
            continue

        tt = input.split(',')
        '''
        0  = TIMESTAMP
        1  = OUTPUT ENABLE    --- i guess to select matrix board 1 or 2
        2  = LATCH                               but we can ignore this
        3  = CLOCK
        4  = E    MSB --\
        5  = D           \
        6  = C            >-- ROW ADDRESS
        7  = B           /
        8  = A    LSB --/
        9  = B2  ---\
        10 = B1      \
        11 = G2       \____RGB COLORS
        12 = G1       /                B1,G1,R1 = top half of matrix
        13 = R2      /                 B2,G2,R2 = bottom half of matrix
        14 = R1  ---/
        '''
        if tt[3] != last_clk :
            last_clk = tt[3]
            last_lat = tt[2]
            last_oe = tt[1]

            adr_1 = int(''.join(tt[4:9]),2)
            adr_2 = adr_1+32

            '''
    ive used ansi-vt100 escape sequences to move cursor and change color.
    for a nice overview check: http://www.termsys.demon.co.uk/vtansi.htm


            '''
            color1 = (int(tt[10])*4)+(int(tt[12])*2)+(int(tt[14])*1)
            color2 = (int(tt[9])*4)+(int(tt[11])*2)+(int(tt[13])*1)

            line1 = "\033["+str(adr_1)+";"+str(x)+"H" #place cursor top half
            line1 +='\x1b[6;3'+str(color1)+';40m'+'█' #print a colored block
            line2 = "\033["+str(adr_2)+";"+str(x)+"H" #place cursor bottom half
            line2 +='\x1b[6;3'+str(color2)+';40m'+'█' #print a colored block
            print line1+line2
            f.write(line1+line2) # i know this slows it al down for now
                                 # but we can just cat the output later on
                                 # and hopefully see a nice animation in an
                                 # resonable frame rate.
            x +=1
        if tt[2] == "1":  #end of line
                x= 5